Know when a stretched stock comes back down
Sensifty is a free Chrome extension for people who buy NSE and BSE stocks and hate buying them at the top. It tells you how far a stock has run compared with its own past, shows the levels below the price, and taps you on the shoulder once when it cools off.
82 in August, 41 today. That’s when you hear from us.
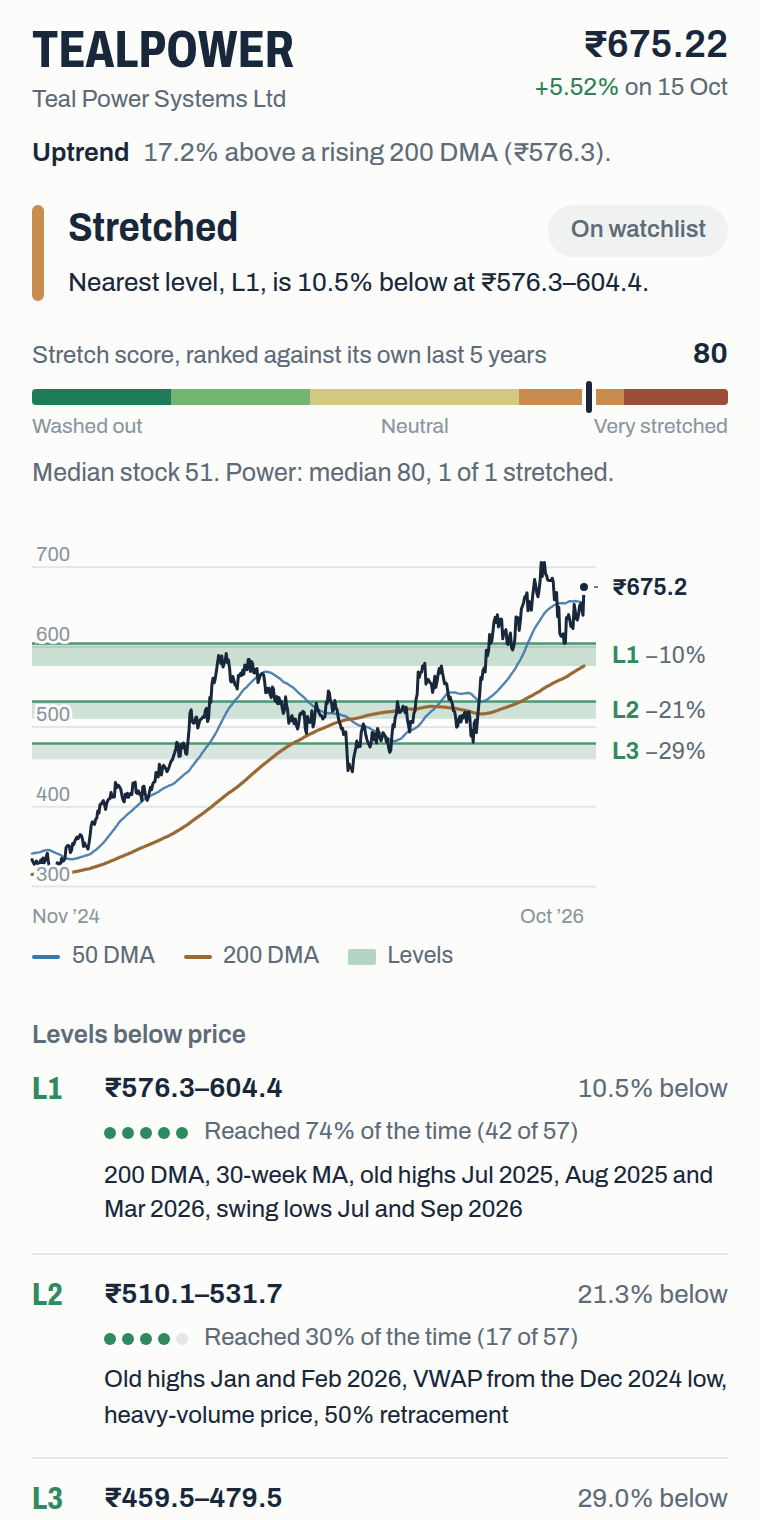
Type a symbol. Here’s what you get.
All of it is worked out from ten years of daily prices, on your own computer, in about a second.
How stretched it is
A score from 0 to 100 that compares where the stock is now with where it usually sits: against its averages, on RSI, inside its Bollinger bands. Everything is ranked against that stock’s own last five years, so 85 means unusually extended for this stock, not just above some line everyone uses.
Which way it’s heading
Is the price above or below its long-term average, and is that average rising or falling? A downtrend has to hold for a few sessions before it counts, so one bad week doesn’t flip the picture.
The levels below the price
Three levels, L1 to L3, where several well-known reference points agree, with the distance to each. Think of them as places worth looking again, not floors.
Its own track record
When this stock last came back down from a stretch, and what its price did over the next one and three months. History, not a promise.
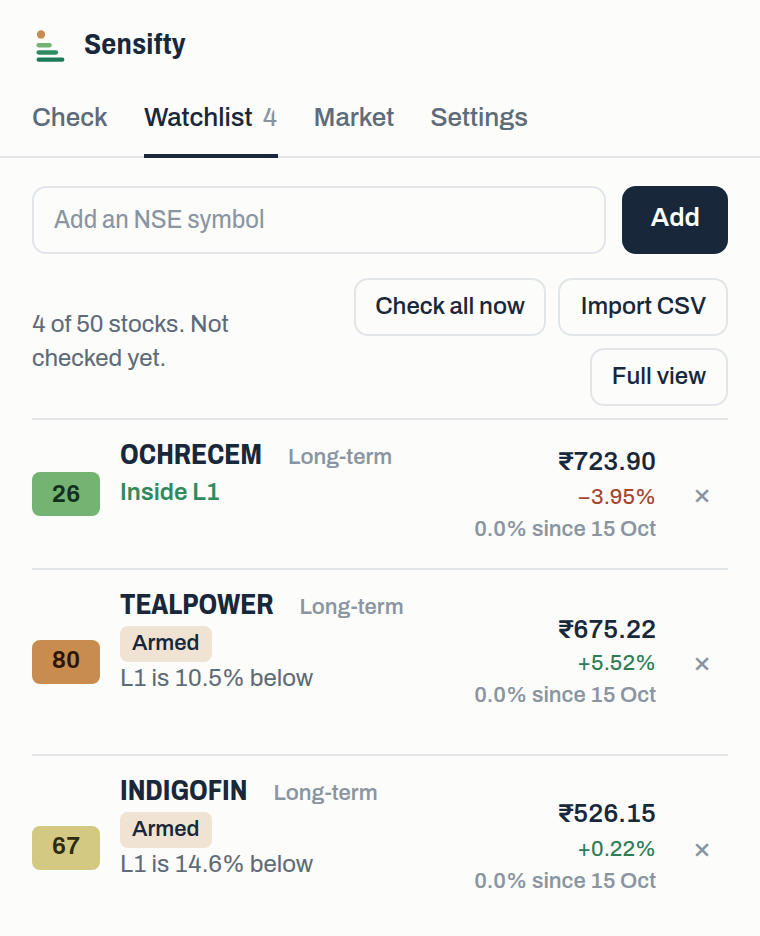
One alert. Then silence.
Add the stocks you’re waiting on. Every trading evening Sensifty checks them while you get on with your life. When one that got stretched comes back down to L1, or its score drops below 40, you get a single notification. Then it goes quiet until that stock is stretched again.
No prices to type in, no alerts to reset, and no pinging every time the market sneezes.
Across NIFTY-50 stocks from 2005 to 2021, that worked out to two or three alerts per stock a year. Rare enough that you’ll actually read them.
What it does, and what it won’t
It does
- Show how stretched a stock is against its own history
- Mark the levels below the price, and how far away they are
- Tell you once when a stretched stock comes back down
- Keep your watchlist on your own computer
- Show its working, so you can check any number
It won’t
- Tell you to buy, sell or hold anything
- Promise returns, or pretend the levels are floors
- Connect to your broker or go anywhere near your money
- Track you, show you ads or sell your data
- Do your homework on the business for you
No crystal ball. No AI.
People ask whether Sensifty uses AI. It doesn’t. There’s no model in here guessing tomorrow’s price, and nothing quietly learning your habits. Every number is plain arithmetic on prices: averages, ranks, distances.
Ask why a score is 82 and the working is all there, like a maths answer sheet with every step shown. That’s deliberate. When your money is involved, you should be able to check the reasoning, not take a black box’s word for it.
Free, and Pro if you want more
Free
₹0
- Check any NSE or BSE stock
- Watch 5 stocks
- Evening alerts on your computer
- Daily market weather
- The latest past alert for each stock
Pro
₹49 a month, or ₹500 a year
- Watch 50 stocks, import them from a CSV
- Live prices and alerts during market hours
- Every stock that came down from a stretch today
- Market and sector context beside every score
- Every past alert, with what happened next
Try all of it free for 30 days first.
We tested it. Here’s the honest bit.
The rules were replayed on sixteen years of daily prices for NIFTY-50 stocks before anyone was asked to pay. Three results are worth knowing before you rely on it:
- Waiting for a pullback changed one-year returns by about one percentage point either way. Timing matters less than most of us like to think.
- When a stock was stretched, waiting paid off slightly more often than not, but the times it kept running cost more.
- The levels held about as often as arbitrary prices at the same depth. They’re reference prices, not floors.
So Sensifty is a tool for patience and attention, not a signal service. The full numbers are here.